How to Protect Your Website against AI Scrapers with Anubis
In this short post I'll explain how I installed Anubis on my server to block AI data scraping bots using Docker and NGINX.
Introduction
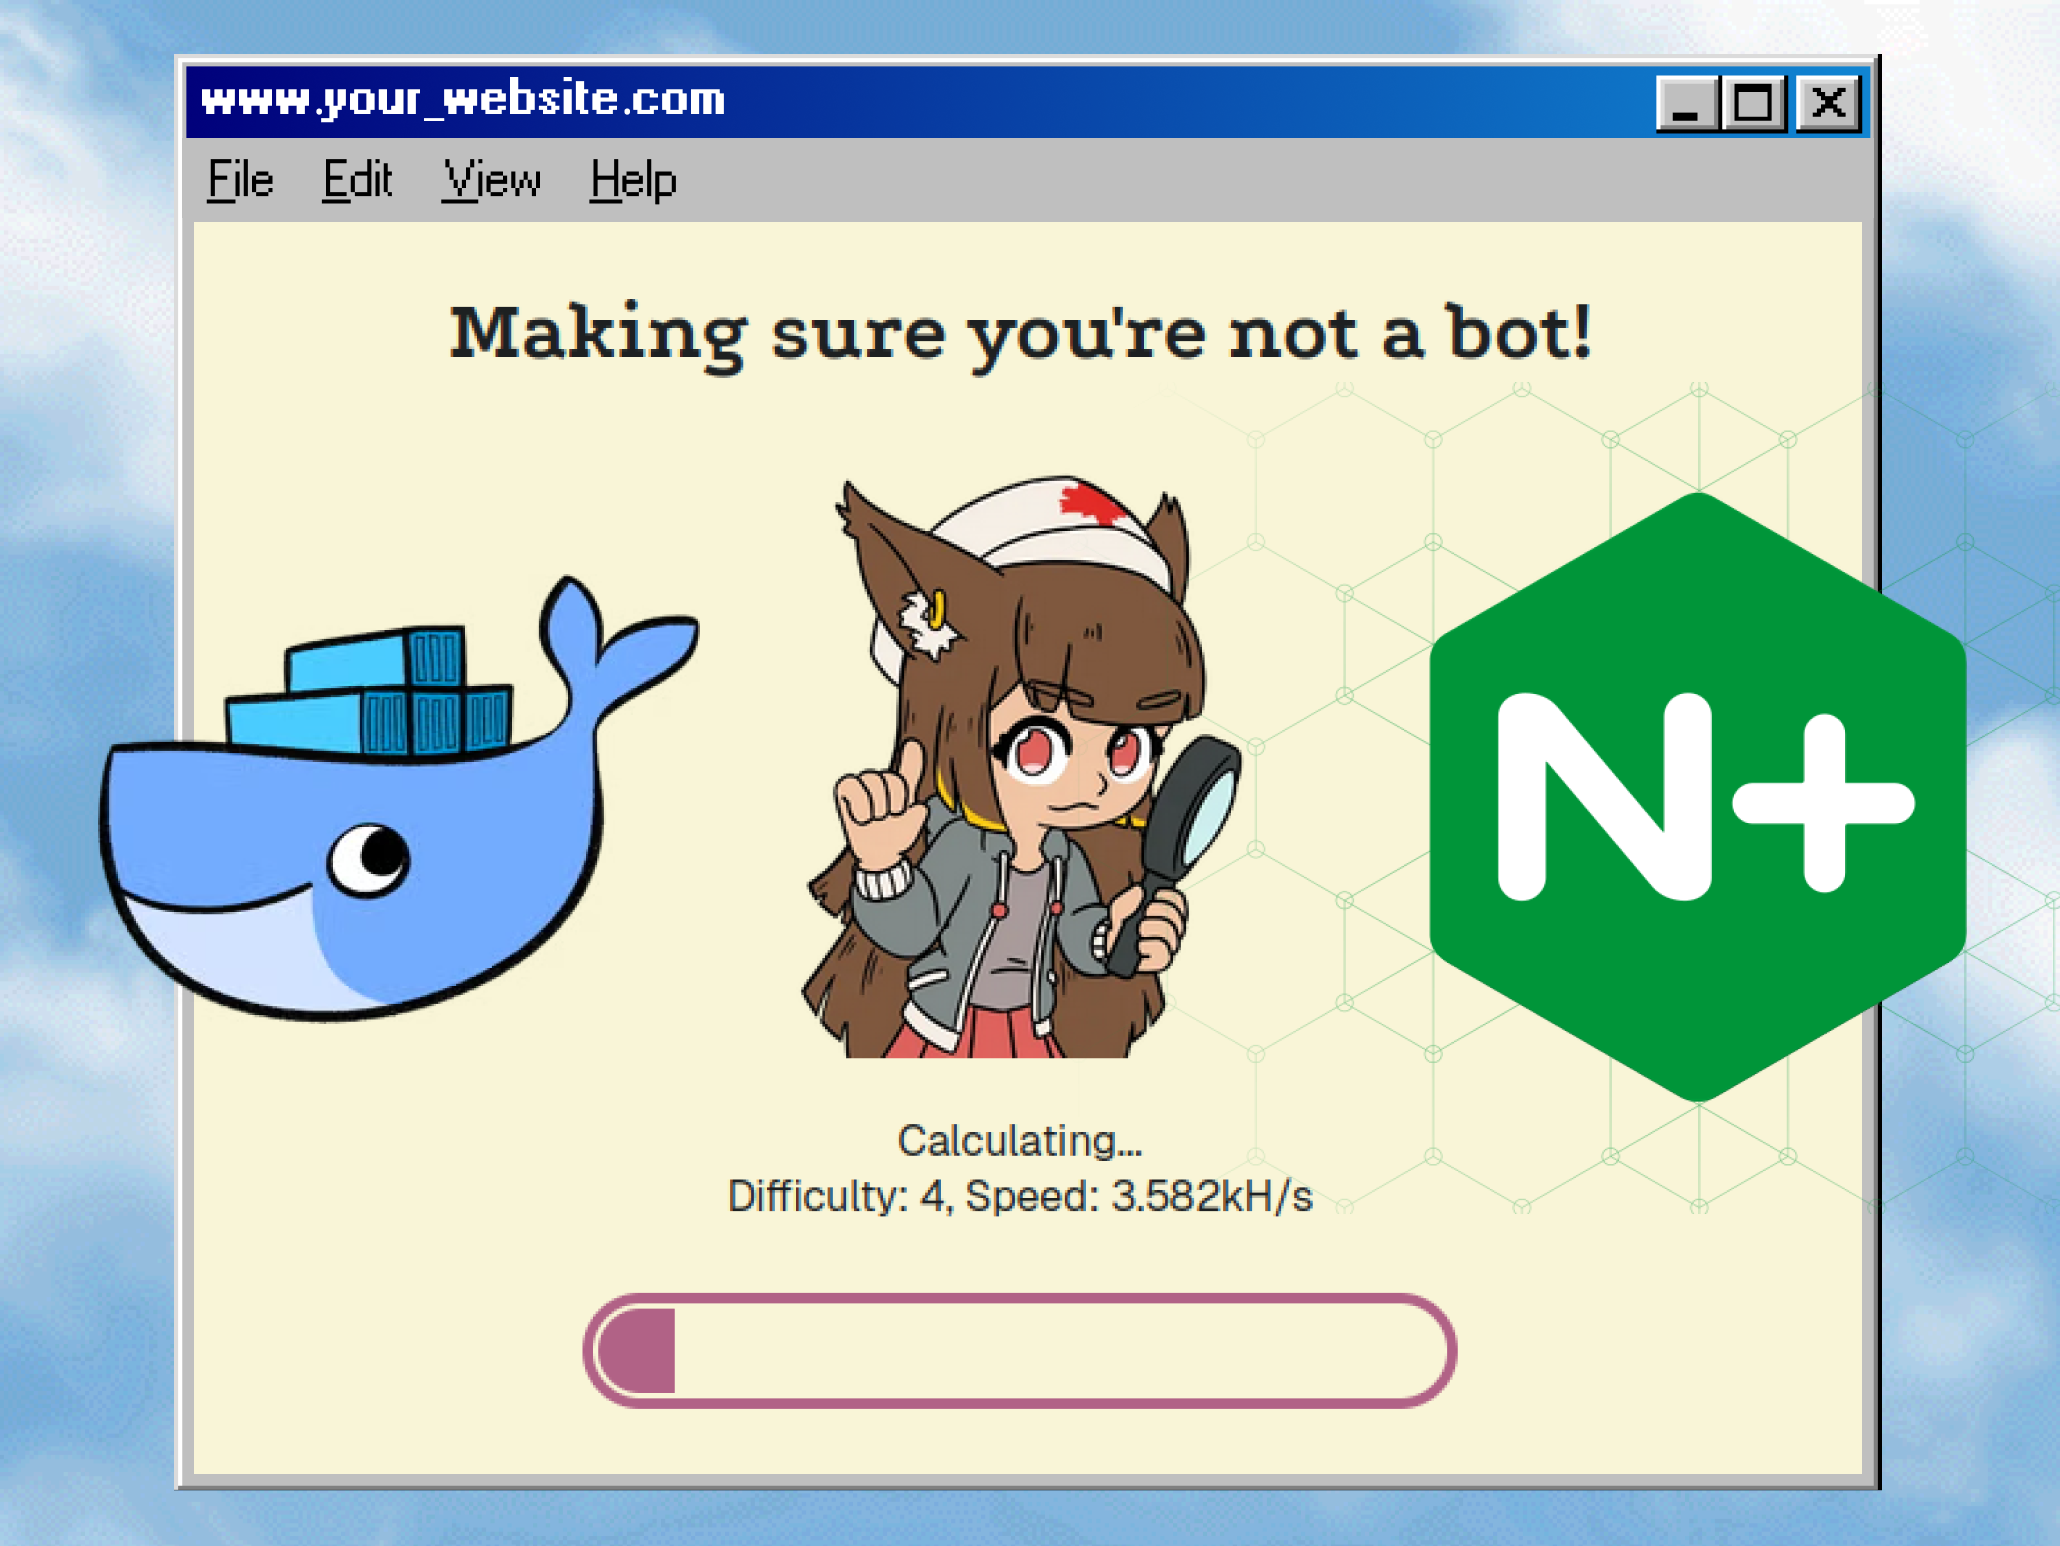
I have been self-hosting my own git codebase for while now, it's a dedicated place for me to organize and share my open source projects with the public. And according to the analytics tool I use it gets a few hundred visits a day from people around the world that either are looking for a specific project or are linked from other websites.
When I check my NGINX access logs of my server directly, though, the story is very different. In a 24hr span on a random day my website received 26,144 requests. 18,575 of those came from AI scrapers. That's roughly 71% of all traffic. These bots include scrapers from OpenAI, Amazon, Anthropic, Google, and Perplexity, among others. They also don't just scrape once. OpenAI's scraper, for instance, sent 4,014 requests to /explore/repos in just 35 minutes. Loading empty pages over and over again in the hopes to get some fresh new data.
If you wanted to block these bots using conventional methods, it would be almost impossible, because many of them don't respect rules like robots.txt. In some cases, they even spoof their headers and disguise themselves as human users just to get around those restrictions. So what can you do?

High-level diagram of Anubis filtering AI bot traffic for a specific docker container.
Enter Anubis, an open-source proof-of-work proxy that filters AI bots. True to its namesake, Anubis weighs the "soul" of each incoming HTTP request before letting it pass through to your website. The idea is based on Hashcash, a concept that was introduced in the 90s to fight email spam.
Anubis sits between your website and the internet, anytime there's a new request the server presents them with a mathematical challenge. For a human that challenge can be solved by their browser in seconds. But for industrial AI bots sending thousands of requests an hour the computational cost increases exponentially. Making your website not worth the effort.
In this post, I'll explain how I implemented Anubis on my website. This tutorial will be specific to my server setup(check the Prerequisites), but you can find other guides for implementing Anubis on a different setup on the Anubis website!
📝NOTE
This tutorial assumes that you have a VPS server running Ubuntu with Docker and NGINX installed.
Prerequisites
- Ubuntu 22.04 cloud server with SSH enabled: Initial Server Setup with Ubuntu 22.04
- A domain name pointed to your server’s IP
- UFW firewall setup
- Docker and Docker Compose: Install Docker on Ubuntu
- NGINX installed as a reverse proxy: How To Configure Nginx as a Reverse Proxy on Ubuntu 22.04
- SSL with Let’s Encrypt: How To Secure Nginx with Let's Encrypt
Install Anubis
Anubis can be configured for your whole website or specific site you want to protect on your server. In my case I'll install it to one of my docker containers which is running Gitea.
Install Anubis on Docker Container
Open you docker-compose.yml file for your existing docker container setup and add the following to the end of your compose file:
... #add this to your existing docker-compose.yml file
  anubis-gitea:
    image: ghcr.io/techarohq/anubis:latest
    container_name: anubis-gitea
    restart: always
    environment:
      - BIND=:8080
      - TARGET=http://server:3000
      - DIFFICULTY=4 #default difficulty
      - OG_PASSTHROUGH=true #enable OG passthrough for link previews
      - OG_EXPIRY_TIME=6h #how often anubis should check for new preview data
      - OG_CACHE_CONSIDER_HOST=true
      - METRICS_BIND=:9090 #optional prometheus metrics
    ports:
      - "127.0.0.1:9001:8080" #you can replace 9001 with any empty port 9000 was taken on my server
    networks:
      - gitea
    depends_on:
- serverOG_PASSTHROUGH, OG_EXPIRY_TIME, OG_CACHE_CONSIDER_HOST helps create a passthrough for link previews. If you do no not set this up the link previews will get blocked by Anubis.
METRICS_BIND=:9090 enables anubis metrics via prometheus, if you have a data monitoring setup with prometheus + graphana you can access the metrics of how many bots were blocked, how many were challanged etc. If not you can remove this line from the file.
next run the container:
docker compose up -dNow we have to edit the server block on NGINX to update the IP adress to Anubis instead of the docker container. In my case the server block can be reached via:
sudo nano /etc/nginx/sites-available/code.gorkyver.comReplace the proxy_pass url with the newly configured anubis address:
server{
        server_name code.gorkyver.com www.code.gorkyver.com;
        location / {
        proxy_pass http://localhost:9001; #replace this with your anubis ip from earlier

        proxy_set_header HOST $host;
        proxy_set_header X-Forwarded-Proto $scheme;
        proxy_set_header X-Real-IP $remote_addr;
        proxy_set_header X-Forwarded-For $proxy_add_x_forwarded_for;
                }
}
save the file and restart NGINX for changes to take effect:
sudo systemctl restart nginxthat's it! If you open your website on a browser now you should see the bot check screen for a split second. You can also check the real time logs to make sure it works properly with:
`docker logs -f anubis-gitea`Metrics with Prometheus + Grafana

If you want to see the metrics or collect data, anubis provides a metrics endpoint that can be configured with grafana to visualise the data.
In my case, I want to maonitor how many of the requests are Denied, challanged etc. here's how I created a piechart for that purpose.
Create Dashboard
In your Grafana Dashboard click Add new panel --> New Dashboard then click Configure visualization. Select Prometheus as the data source if it isn't selected already and then enter this in the query editor code field:
sum by (action) (increase(anubis_policy_results[$__range]))anubis_policy_results: Every time Anubis evaluates a request, it increments this counter. Each increment carries two labels: rule (which policy rule matched (e.g. bot/googlebot, generic-bot-catchall)) and action (what Anubis decided to do about it (ALLOW, DENY, or CHALLENGE))
sum by (action): will group individual ALLOW, DENY and CHALLANGE entries
increase(): gives the total of how much the counter climbed over a given time window.
$__range: will match the time range selected in your dashboard
Next, select pie chart from the right sidebar and save your changes. Now you monitor Anubis metrics next to your server stats!
Conclusion
As the creator of Anubis describes it, this tool is a "nuclear response". It isn't perfect at telling good bots from bad ones, and in some cases it can even block human users (eg. those browsing with JavaScript disabled). It adds an extra layer of friction for people browsing the world wide web, but it's currently the best tool available for staying ahead in the ongoing arms race against AI scrapers, at least until the AI bubble bursts.
Next: Self-Hosted CI/CD Pipeline for Node.js App w/ Gitea Actions & Docker